忽然想起来还没怎么用过 profiling tools,这可是性能分析“杀器”啊,小水一波,兴许以后就用上了🙃。
profiling
profiling,分析。有很多时候,我们都会相对处于 runtime 的程序进行指标 & 特征分析,比如 CPU 使用情况、内存使用情况,race 检测等。
Flame Graphs(火焰图)
Flame Graph,火焰图。火焰图是一种常用的可视化分析性能数据的方式。不同类型火焰图适合不同的性能分析优化场景。
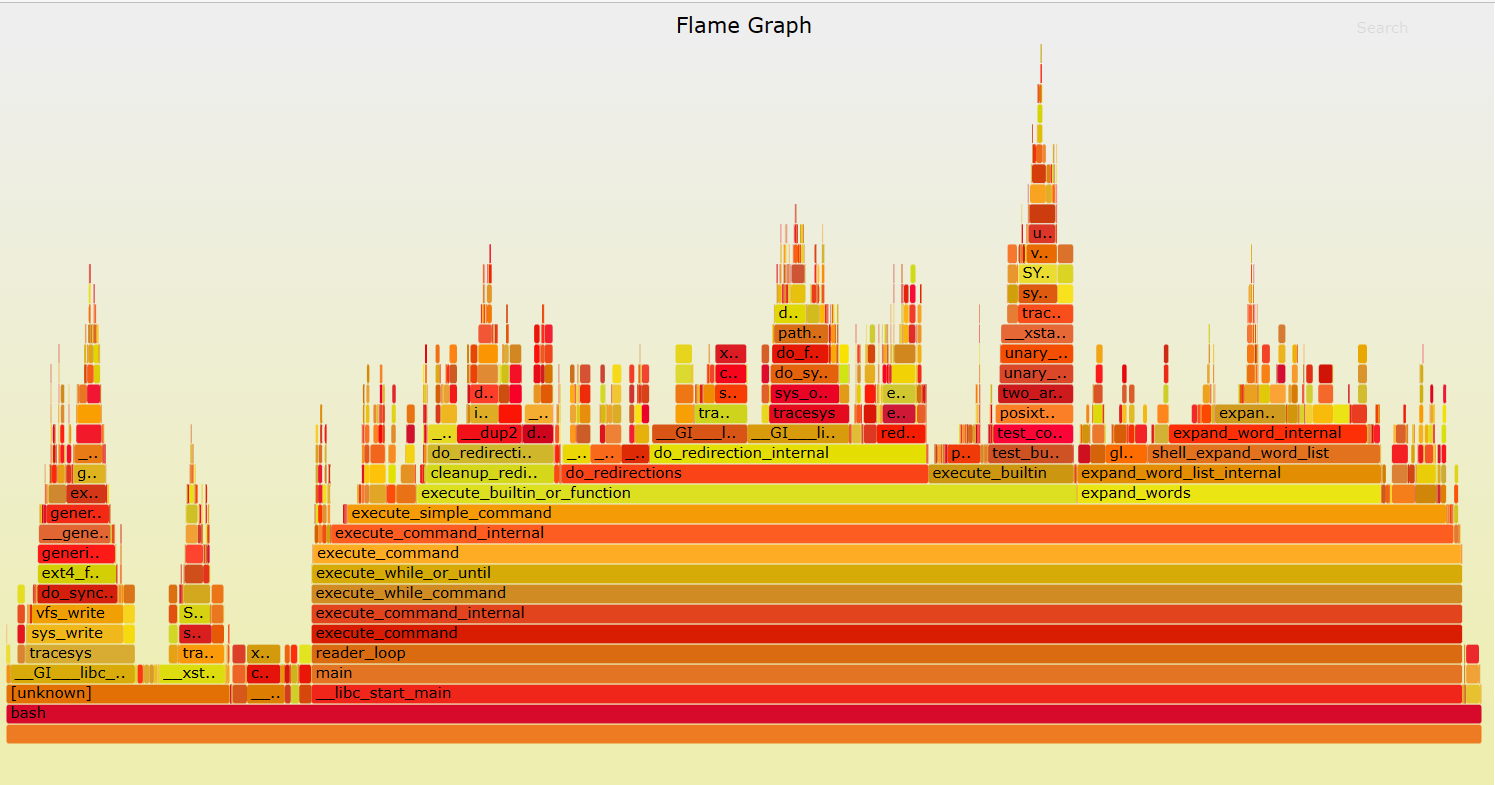
上图为 CPU 使用情况的 Flame Graph,来自 -> (https://github.com/brendangregg/FlameGraph。通过该图,我们可以找到 CPU 占用最多的函数,分析代码热路径。特征如下:
- 纵轴:表函数调用栈,上层函数时下层函数的子函数;
- 横轴:表示 CPU 占用时间,越长表示占用时间越多;
值得注意的是:横轴先后顺序是为了聚合,跟函数间依赖或调用关系无关;一般情况下,火焰图各种颜色是为方便区分,本身不具有特殊含义。
小试一下
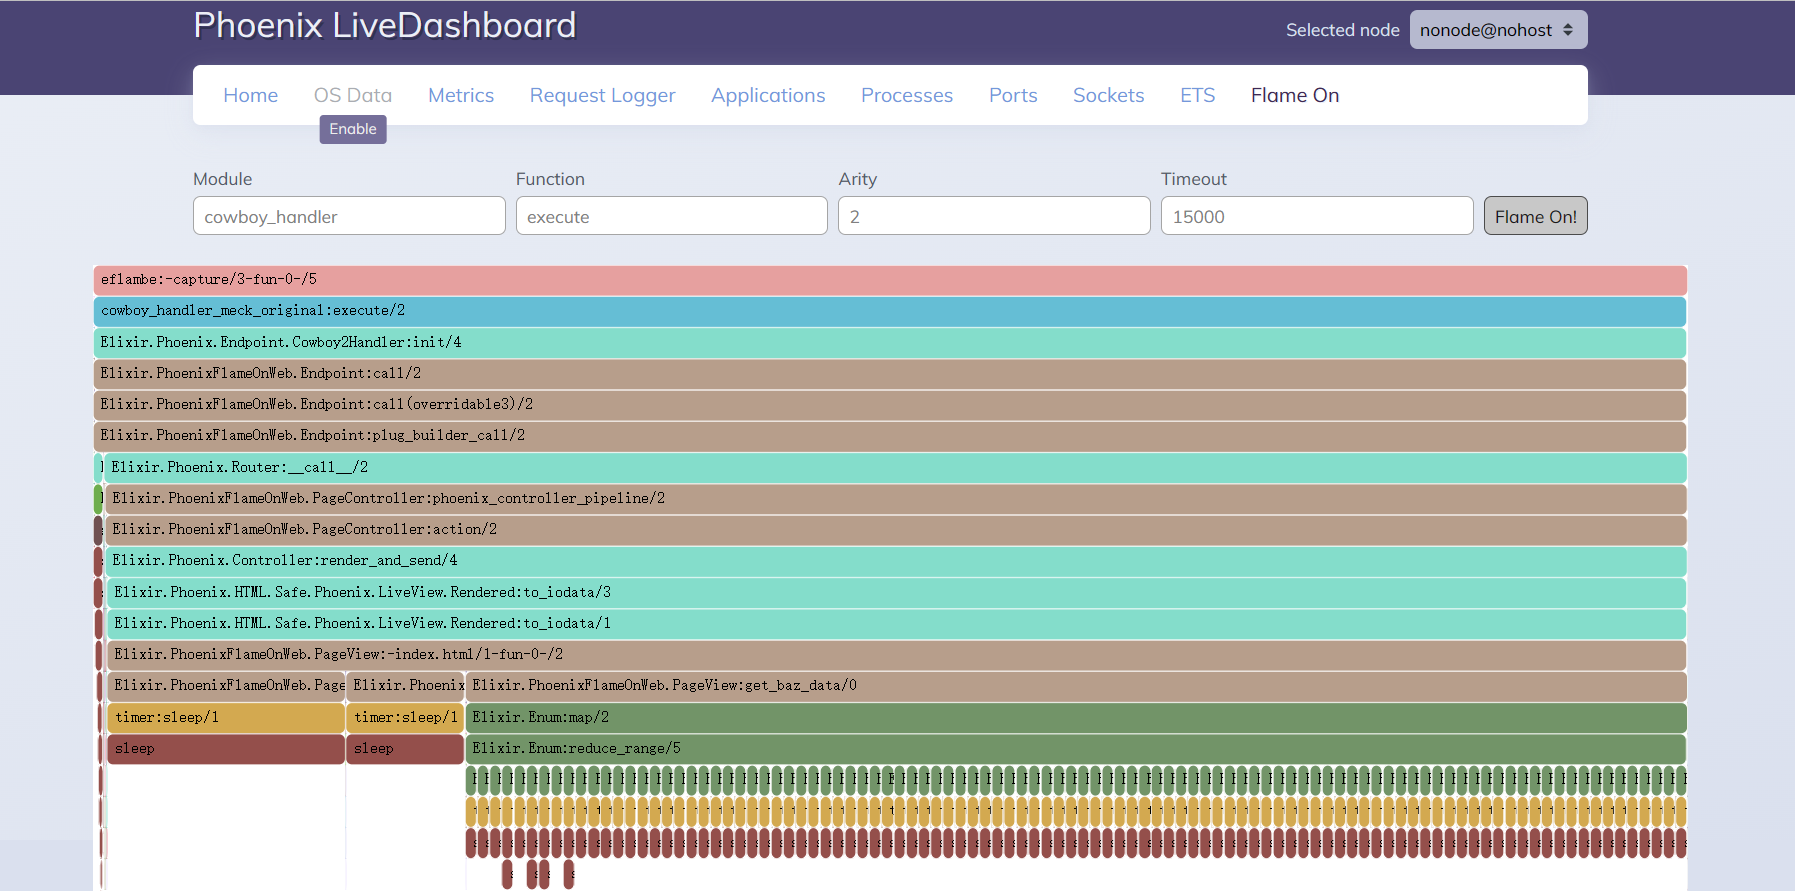
Elixir Phoenix Framework & Flame On
根据这篇 Toturial -> Profiling Elixir Applications with Flame Graphs and Flame On,我们在 Phoenix App Telemetry Dashboard 中集成 Flame On,GET 到如下 Flame Graph:
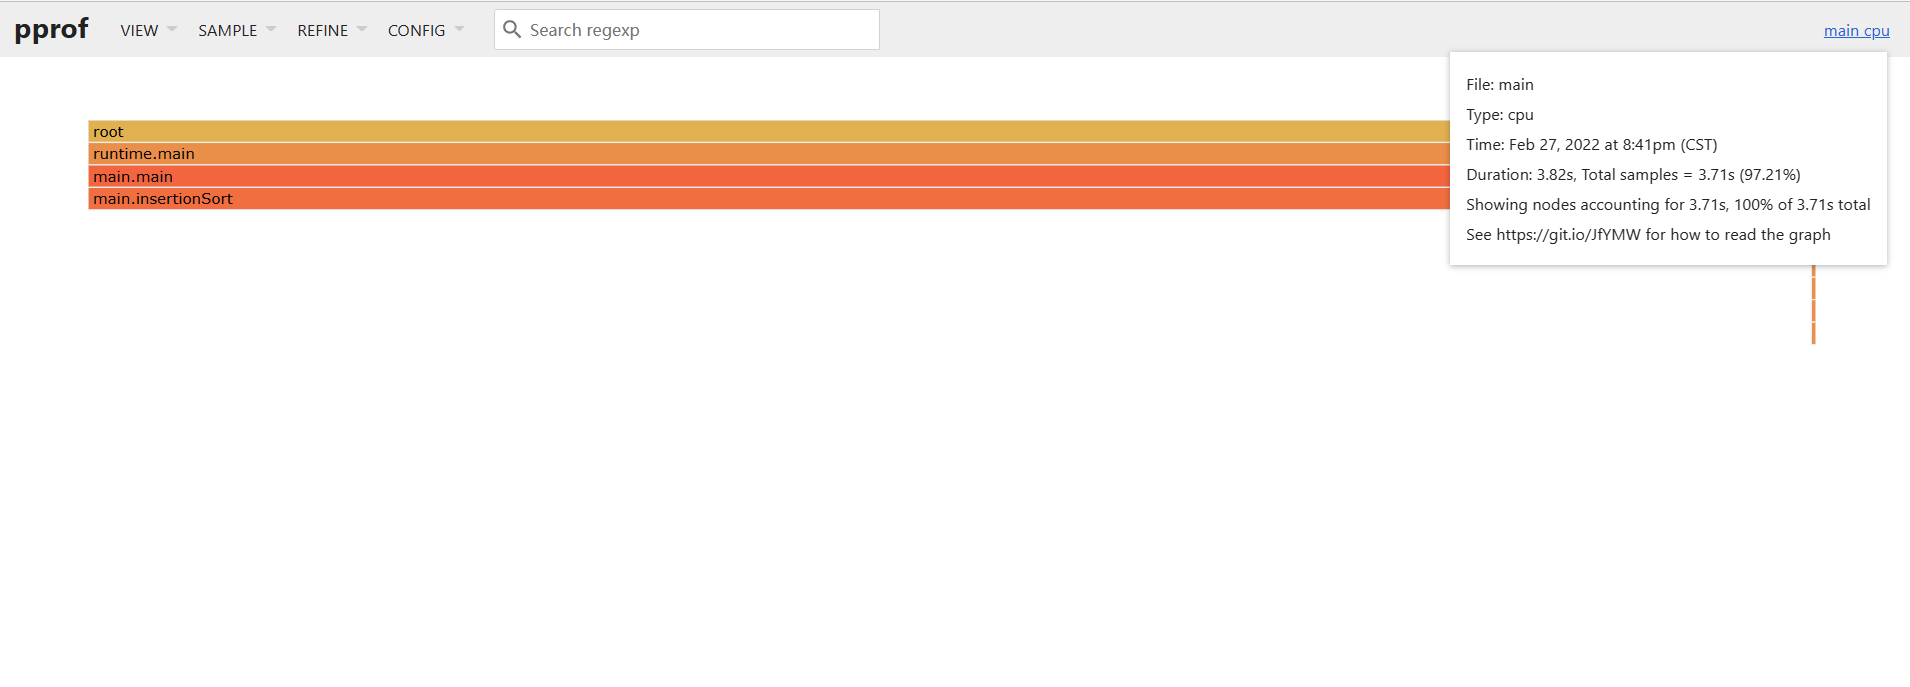
Go && pprof
Go 内置了 profiling 工具 [pprof][https://github.com/google/pprof] 方便我们对程序进行分析,通过 runtime/pprof 包,我们可以在程序中指定位置埋下采集点。
1 | package main |
1 | go run main.go # 生成 cpu.pprof profiling 文件 |
然后可以 GET 到类似如下得 Flame Graphs,就挺不 Simplex 的,2333:
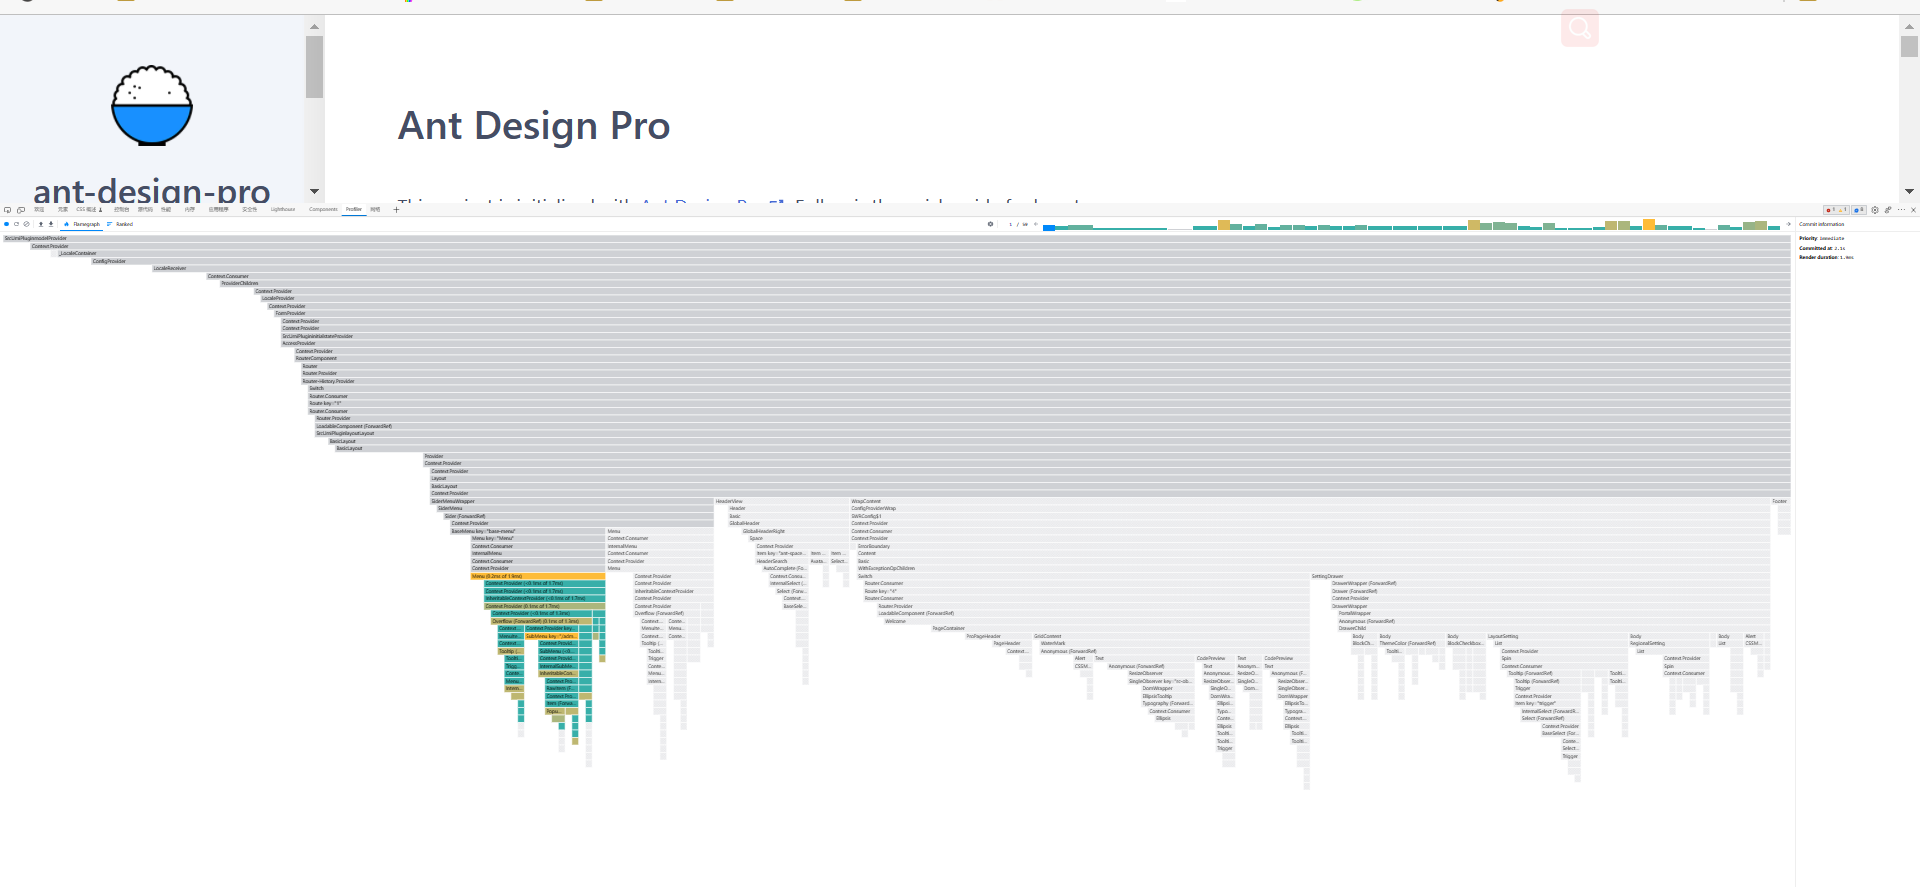
React
React App 的 profiling 我们可以借助浏览器扩展 React DevTools 进行,也可以在使用官方提供的 Profiler API.
我们起个 Ant-Design Pro 来看看:https://github.com/ant-design/ant-design-pro
1 | yarn create umi |