基于 Docker 搭建一个最小化的 Prometheus Federation「联邦」集群
一不小心就八月末了,我敲,最近大部分的时间都在了解 Prometheus,一直想“搂”篇文章出来,奈何一直在墨迹,是时候了,不然就九月了,完不成博客的 Flag 了,233333。
前言 本篇文章主要介绍了 Promethues Federation 集群化机制 & 基于 Docker 搭建一个最小化的 Prometheus Federation 集群娱乐环境的相关操作。不是 Step By Step 的。
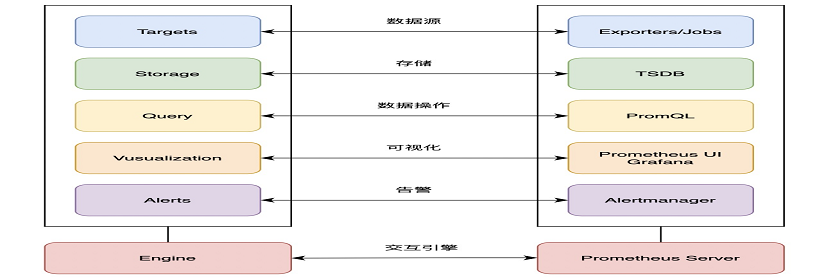
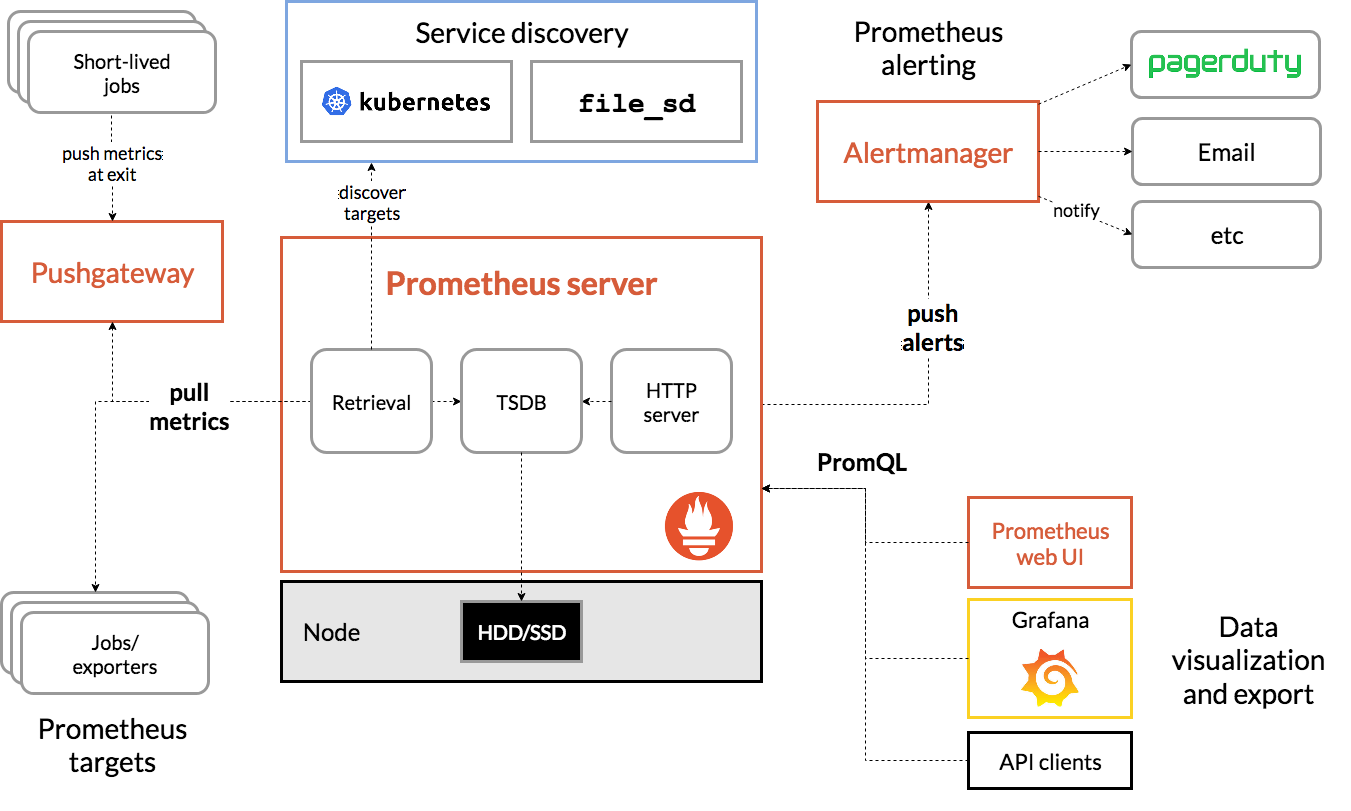
Prometheus 先回顾一下 Prometheus 的各个生态组件,了解下它们各自承担的责任是是什么。基于下面一张来自 Prometheus 官方文档的架构 & 生态组件图做下简介:
Prometheus targets(Jobs/exporters):提供监控 Metrics 的数据源,Prometheus 是基于拉(Pull-Based)模型的监控系统;
Pushgateway:Metrics 推送网关,Prometheus 拉取 Metrics 是有时间间隔的,有时候一些短时任务(Short-lived jobs)没有等到 Prometheus 过来拉取其 Metrics 就没了,所以提供了一个这样的组件让 Jobs 主动推送 Metrics 到作为中介的 Pushgateway 组件;
Prometheus Server:核心组件
Retrieval:Prometheus 的通过 yaml 配置文件进行配置的,可以配置 Prometheus 拉取 Metrics 的时间间隔,告警规则计算配置,爬取数据源配置等能力;
TSDB:Prometheus 内置的本地存储时间序列数据库,该数据库经历了从原型到 V1 到现在 V2 版本的演进,做了许多的优化,想了解更多细节可以看看这篇文章 The Evolution of Prometheus Storage Layer ;Exporters 是基于文本格式进行 Metrics 的暴露的, V2 版本Prometheus 放弃了原有的 Protocol Buffers 序列化协议,实现了 Text Decoder,优化了性能,官方对此更多的考虑可以看看这篇文档: protobuf_vs_text ;
HTTP Server:提供了与 TSDB 和 Prometheus 交互的 HTTP API,方便在更多的场景下做一些自定义操作;
Service discovery:服务发现机制,Prometheus 内置了基于文本文件、DNS Server和 Consul 的服务发现机制(都可以在配置文件进行配置),规模化监控场景下,方便发现 Prometheus 的爬取对象进行 Metrics 拉取;
Alertmanager:告警通知组件,提供了告警分组,告警抑制(Inhibit),告警静默(Silence),邮件通知,WebHook 等机制;值得注意的是 Prometheus Server 提供了告警规则的计算能力,但是通知并不由它完成,而是由 Alertmanager 完成。告警通知是个重活,并不简单。文章搞搞 Prometheus: Alertmanager 对 Alertmanager 进行了深层次的分析,可以微微看下;
PromQL:Prometheus 提供的一个 DSL,同于用于时序数据的查询与聚合运算等操作,告警规则(Alerting Rules & Recording Rules)的计算也用到了 PromQL;
Prometheus Web UI:Prometheus 自带的一个 Web UI,提供了许多的数据可视化能力,但其对可视化图表的支持有限,所以社区出现了 Grafana 可视化工具,其提供的 Dashboard 管理能力是很强大的,但仍然有缺点,比如这篇文章就说了一点 如何使 Grafana as code 。
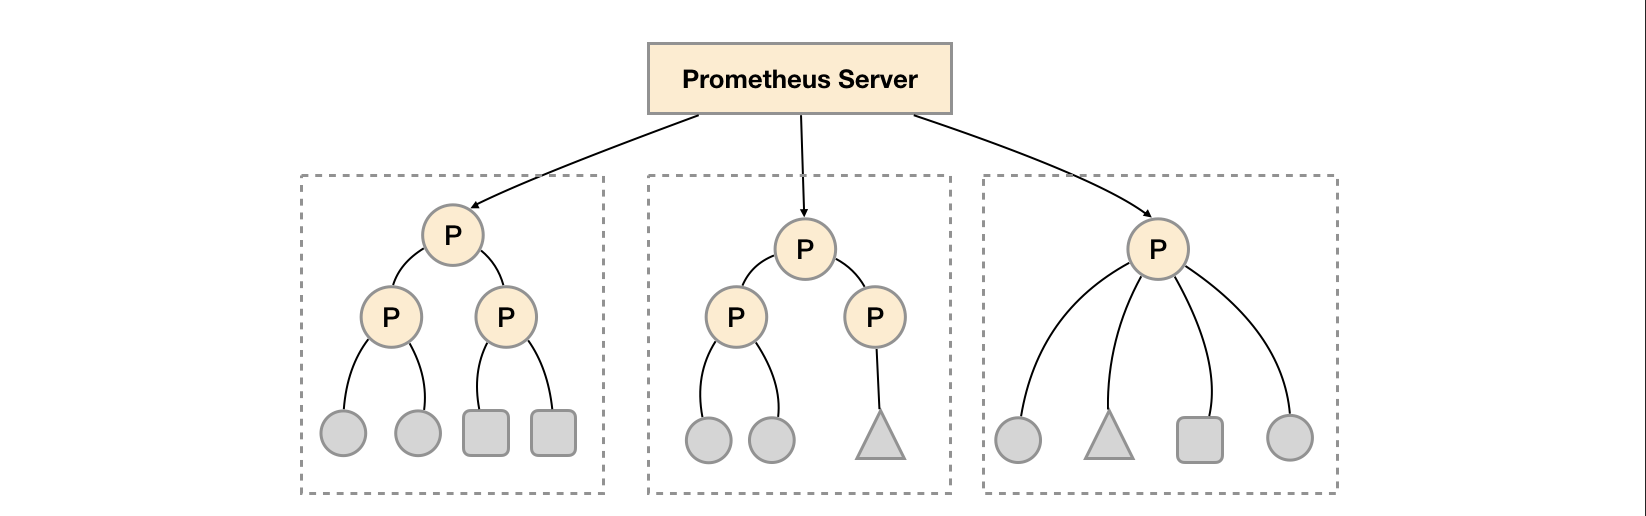
Federation 机制 Pormetheus Federation(联邦)机制是 Promehteus 本身提供的一种集群化的扩展能力。当我们要监控的服务很多的时候,我们会部署很多的 Prometheus 节点分别 Pull 这些服务暴露的 Metrics,Federation 机制可以讲这些分别部署的 Prometheus 节点所获得的指标聚合起来,存放在一个中心点的 Prometheus。如下图:
在 Prometheus 的配置配置文件,调整如下字段即可使用 Federation 机制:
1
2
3
4
5
6
7
8
9
10
11
12
13
14
15
16
17
18
19
20
21
scrape_configs: - job_name: 'federate' scrape_interval: 10s honor_labels: true metrics_path: '/federate' params: 'match[]' : - '{job="prometheus"}' - '{job="node"}' - '{job="blackbox"}' static_configs: - targets: - 'prometheus-follower-1:9090' - 'prometheus-follower-2:9090'
关于 Federation 联邦集群更多的讨论可以看看:别再乱用prometheus联邦了,分享一个multi_remote_read的方案来实现prometheus高可用
基于服务功能分区,我们可以通过 Federation 集群的特性在任务级别对 Prometheus 采集任务进行划分,以支持规模的扩展。
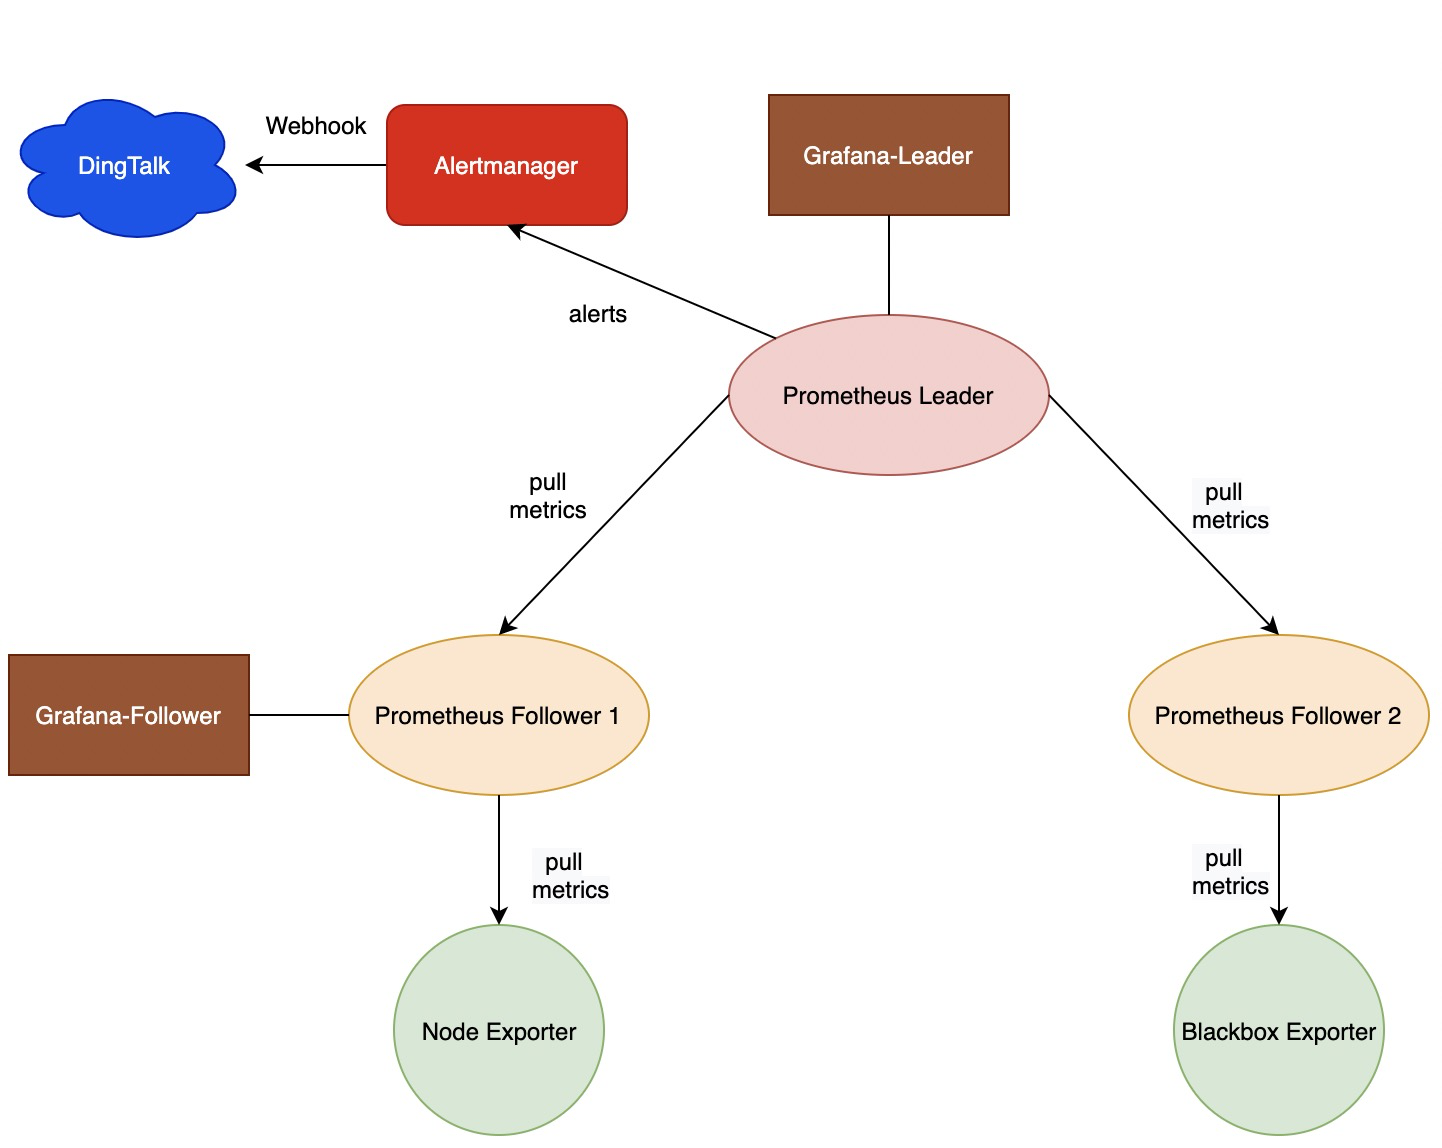
基于 Docker 搭建最小化的 Federation 集群 上文微微 Recap 了一下 Prometheus「普罗米修斯」相关知识,现在回到最小化 Federation 的搭建,本次要搭建的一个最小化 Federation 集群(Architecture)如下图:
可以看到,这里我们使用了两个 Prometheus Follower Container 分别对 Node Exporter 和 Black Exporter 暴露的主机状态相关的 Metrics 和 网络状况相关的 Metrics 进行拉(Pull)取,然后通过一个中心的 Prometheus Leader 对上述指标进行聚合。我们还分别给 Leader 和 一个 Follower 部署了可视化面板 Grafana 用于查看 Metrics。Alertmanager 也通过容器化的方式启动。
告警的通知基于 WebHook,这里使用到了钉钉群机器人,配置了主机内存 & CPU 使用情况的告警,规则如下:
1
2
3
4
5
6
7
8
9
10
11
12
13
14
15
16
17
18
19
20
21
22
23
24
25
26
27
28
29
30
31
groups: - name: targets rules: - alert: monitor_service_down expr: up == 0 for: 30s labels: severity: critical annotations: summary: "Monitor service non-operational" description: "Service {{ $labels.instance }} is down." - name: host rules: - alert: high_cpu_load expr: node_load1 > 1.5 for: 30s labels: severity: warning annotations: summary: "Server under high load" description: "Docker host is under high load, the avg load 1m is at {{ $value}} . Reported by instance {{ $labels.instance }} of job {{ $labels.job }} ." - alert: high_memory_load expr: (sum(node_memory_MemTotal_bytes) - sum(node_memory_MemFree_bytes + node_memory_Buffers_bytes + node_memory_Cached_bytes) ) / sum(node_memory_MemTotal_bytes) * 100 > 45 for: 30s labels: severity: warning annotations: summary: "Server memory is almost full" description: "Docker host memory usage is {{ humanize $value}} %. Reported by instance {{ $labels.instance }} of job {{ $labels.job }} ."
我们通过 Docker Volume 挂载的方式讲 Prometheus 的配置文件和告警规则文件挂载到对应的识别路径;Grafana 的 Dashboard 与登陆相关的配置我们也基于此方式。Prometheus 的更多配置可参考 prometheus configuration :;Grafana 更多的配置参数可以参考:Grafana Provisioning 。
Federation 集群的通信我们创建了一个 Docker Network「monitoring_network」。我们使用 Docker—Compose 进行容器的编排,编排文件内容如下:
docker-compose.yml
1
2
3
4
5
6
7
8
9
10
11
12
13
14
15
16
17
18
19
20
21
22
23
24
25
26
27
28
29
30
31
32
33
34
35
36
37
38
39
40
41
42
43
44
45
46
47
48
49
50
51
52
53
54
55
56
57
58
59
60
61
62
63
64
65
66
67
68
69
70
71
72
73
74
75
76
77
78
79
80
81
82
83
84
85
86
87
88
89
90
91
92
93
94
95
96
97
98
99
100
101
102
103
104
105
106
107
108
109
110
111
112
113
114
115
116
117
118
119
120
121
122
123
124
125
126
127
128
129
130
131
132
133
134
135
136
137
138
139
140
141
142
143
144
145
146
version: '3.5' networks: monitoring_network: volumes: prometheus_leader_data: {} prometheus_follower_1_data: {} prometheus_follower_2_data: {} grafana_leader_data: {} grafana_follower_data: {} services: prometheus-leader: container_name: prometheus-leader image: prom/prometheus networks: - monitoring_network volumes: - ./configs/prometheus-leader/prometheus.yml:/etc/prometheus/prometheus.yml - ./configs/prometheus-leader/alerts/alert.rules:/etc/prometheus/alert.rules - prometheus_leader_data:/prometheus ports: - "9090:9090" command: - '--config.file=/etc/prometheus/prometheus.yml' - '--storage.tsdb.path=/prometheus' - '--web.console.libraries=/etc/prometheus/console_libraries' - '--web.console.templates=/etc/prometheus/consoles' restart: unless-stopped prometheus-follower-1: container_name: prometheus-follower-1 image: prom/prometheus networks: - monitoring_network volumes: - ./configs/prometheus-follower-1/prometheus.yml:/etc/prometheus/prometheus.yml - ./configs/prometheus-follower-1/records/node_exporter_recording.rules:/etc/prometheus/node_exporter_recording.rules - ./configs/prometheus-follower-1/alerts/node_exporter_alert.rules:/etc/prometheus/node_exporter_alert.rules - prometheus_follower_1_data:/prometheus ports: - "9099:9090" command: - '--config.file=/etc/prometheus/prometheus.yml' - '--storage.tsdb.path=/prometheus' - '--web.console.libraries=/etc/prometheus/console_libraries' - '--web.console.templates=/etc/prometheus/consoles' restart: unless-stopped prometheus-follower-2: container_name: prometheus-follower-2 image: prom/prometheus networks: - monitoring_network volumes: - ./configs/prometheus-follower-2/prometheus.yml:/etc/prometheus/prometheus.yml - prometheus_follower_2_data:/prometheus ports: - "9098:9090" command: - '--config.file=/etc/prometheus/prometheus.yml' - '--storage.tsdb.path=/prometheus' - '--web.console.libraries=/etc/prometheus/console_libraries' - '--web.console.templates=/etc/prometheus/consoles' restart: unless-stopped grafana_leader: container_name: grafana_leader image: grafana/grafana networks: - monitoring_network volumes: - ./configs/grafana-leader/provisioning/dashboards:/etc/grafana/provisioning/dashboards - ./configs/grafana-leader/provisioning/datasources/config.yml:/etc/grafana/provisioning/datasources/config.yml - grafana_leader_data:/etc/grafana environment: - TERM=linux - GF_INSTALL_PLUGINS=grafana-clock-panel,grafana-simple-json-datasource - GF_SECURITY_ADMIN_USER=admin - GF_SECURITY_ADMIN_PASSWORD=admin123456 ports: - "3000:3000" restart: unless-stopped grafana_follower: container_name: grafana_follower image: grafana/grafana networks: - monitoring_network volumes: - ./configs/grafana-follower/provisioning/dashboards:/etc/grafana/provisioning/dashboards - ./configs/grafana-follower/provisioning/datasources/config.yml:/etc/grafana/provisioning/datasources/config.yml - grafana_follower_data:/etc/grafana environment: - TERM=linux - GF_INSTALL_PLUGINS=grafana-clock-panel,grafana-simple-json-datasource - GF_SECURITY_ADMIN_USER=admin - GF_SECURITY_ADMIN_PASSWORD=admin123456 ports: - "3001:3000" restart: unless-stopped node_exporter: image: quay.io/prometheus/node-exporter:latest container_name: node_exporter_stats networks: - monitoring_network ports: - "9100:9100" expose: - "9100" restart: unless-stopped blackbox_exporter: image: prom/blackbox-exporter container_name: blackbox_exporter networks: - monitoring_network ports: - "9115:9115" restart: unless-stopped alertmanager: image: prom/alertmanager container_name: alertmanager networks: - monitoring_network volumes: - ./configs/alertmanager/alertmanager.yml:/etc/alertmanager/alertmanager.yml ports: - "9093:9093" restart: unless-stopped dingtalk-robot: image: timonwong/prometheus-webhook-dingtalk container_name: dingtalk-robot networks: - monitoring_network ports: - "8060:8060" volumes: - ./configs/dingtalk/config.yml:/etc/prometheus-webhook-dingtalk/config.yml restart: unless-stopped
dingtalk 通知的配置参考了这篇文章:将钉钉接入 Prometheus AlertManager WebHook 。
已经相关的配置文件和容器编排文件上传到了 GitHub,更多的配置细节可以到 GitHub 的项目仓库 yeshan333/prometheus-federation-minimal-demo 查看,也可将该项目 clone 到本地,跑一下看看:
1
2
git clone https://github.com/yeshan333/prometheus-federation-minimal-demo cd prometheus-federation-minimal-demo
2、更换钉钉机器人的 WebHook 地址,机器人配置的 Webhook 地址在 configs/dingtalk/config.yml 文件;
1 vim configs/dingtalk/config.yml
1
2
3
targets: webhook1: url: https://oapi.dingtalk.com/robot/send?access_token=<dingtalk-robaot-access-token>
3、通过 docker-compose 启动联邦集群,你可能需要安装 Docker & docker-compose,可参考:Get Docker ;
1
2
3
4
5
6
7
8
9
10
11
$ docker-compose ps NAME COMMAND SERVICE STATUS PORTS alertmanager "/bin/alertmanager -…" alertmanager running 0.0.0.0:9093->9093/tcp, :::9093->9093/tcp blackbox_exporter "/bin/blackbox_expor…" blackbox_exporter running 0.0.0.0:9115->9115/tcp, :::9115->9115/tcp dingtalk-robot "/bin/prometheus-web…" dingtalk-robot running 0.0.0.0:8060->8060/tcp, :::8060->8060/tcp grafana_follower "/run.sh" grafana_follower running 0.0.0.0:3001->3000/tcp, :::3001->3000/tcp grafana_leader "/run.sh" grafana_leader running 0.0.0.0:3000->3000/tcp, :::3000->3000/tcp node_exporter_stats "/bin/node_exporter" node_exporter running 0.0.0.0:9100->9100/tcp, :::9100->9100/tcp prometheus-follower-1 "/bin/prometheus --c…" prometheus-follower-1 running 0.0.0.0:9099->9090/tcp, :::9099->9090/tcp prometheus-follower-2 "/bin/prometheus --c…" prometheus-follower-2 running 0.0.0.0:9098->9090/tcp, :::9098->9090/tcp prometheus-leader "/bin/prometheus --c…" prometheus-leader running 0.0.0.0:9090->9090/tcp, :::9090->9090/tcp
End.